Cybersecurity
This case study reflects real work for a high-security client. Some details are omitted to protect confidentiality and honor NDAs. The challenges, solutions, and outcomes are authentic. If you would like more information or a private walkthrough, I would be more than happy to show you. Please feel free to contact me.

Background & Challenge
Fortress is a cybersecurity leader specializing in AI-powered supply chain risk management for critical infrastructure, providing utilities and government agencies with proactive protection against advanced cyber threats and compliance challenges.
As global risk events, like geopolitical instability, cyberattacks, and supply chain shocks, became more frequent, Fortress Information Security users needed a centralized way to monitor real-time disruptions and understand their impact on third-party vendors. However, the platform lacked any kind of spatial or contextual view of vendor risk.
There was no existing solution to correlate live events with vendor locations or assess how a disruption in one region might ripple through the supply chain. Risk managers were left scrambling, often relying on manual updates, spreadsheets, or siloed tools that lacked real-time visibility.
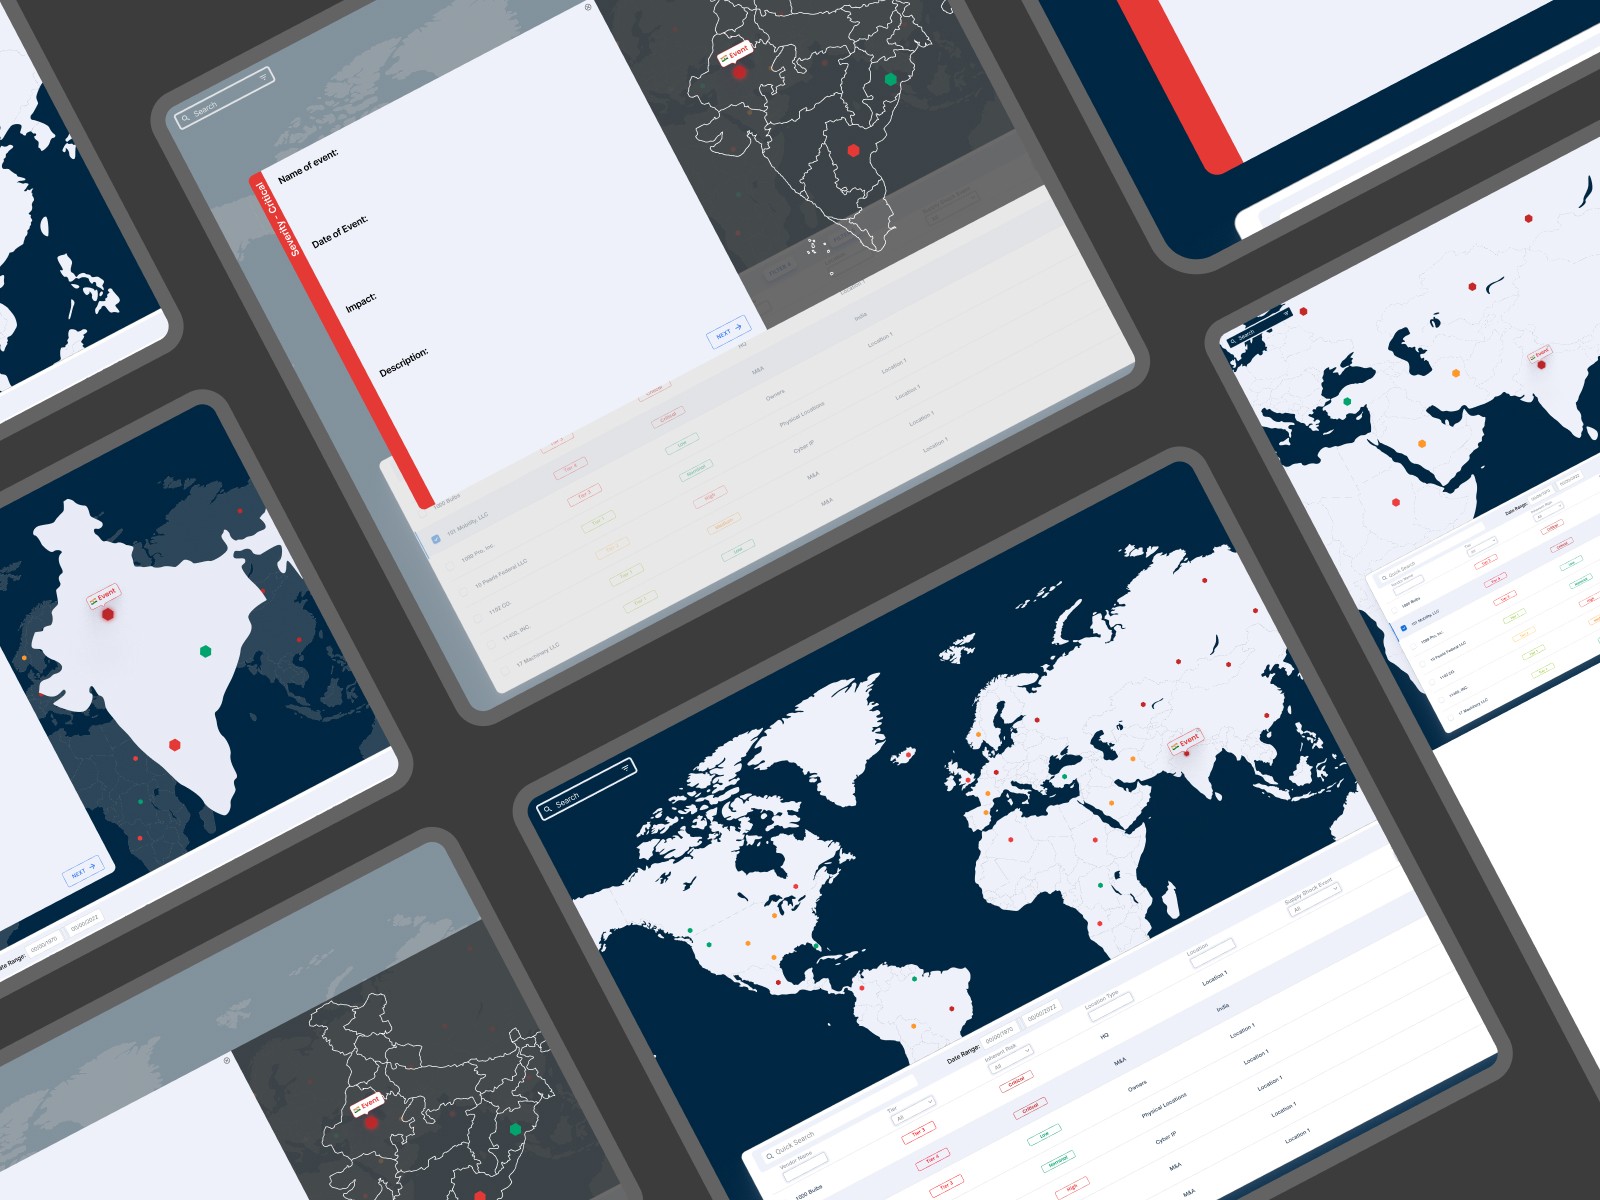
The challenge was to create a brand-new capability: a Global Risk Incident Dashboard with a live interactive map showing vendor distribution and tagging real-time disruptions, allowing users to assess exposure quickly, triage risk, and make proactive decisions.
Solution
As Lead Designer, I drove the vision, strategy, and execution of a groundbreaking risk visualization feature suite that revolutionized how security and procurement teams detect and respond to vendor disruptions. By collaborating closely with the VP of Product and Head of Engineering, I translated complex risk data into an intuitive, actionable experience that empowered users to make faster, smarter decisions in real time.
Key innovations included:
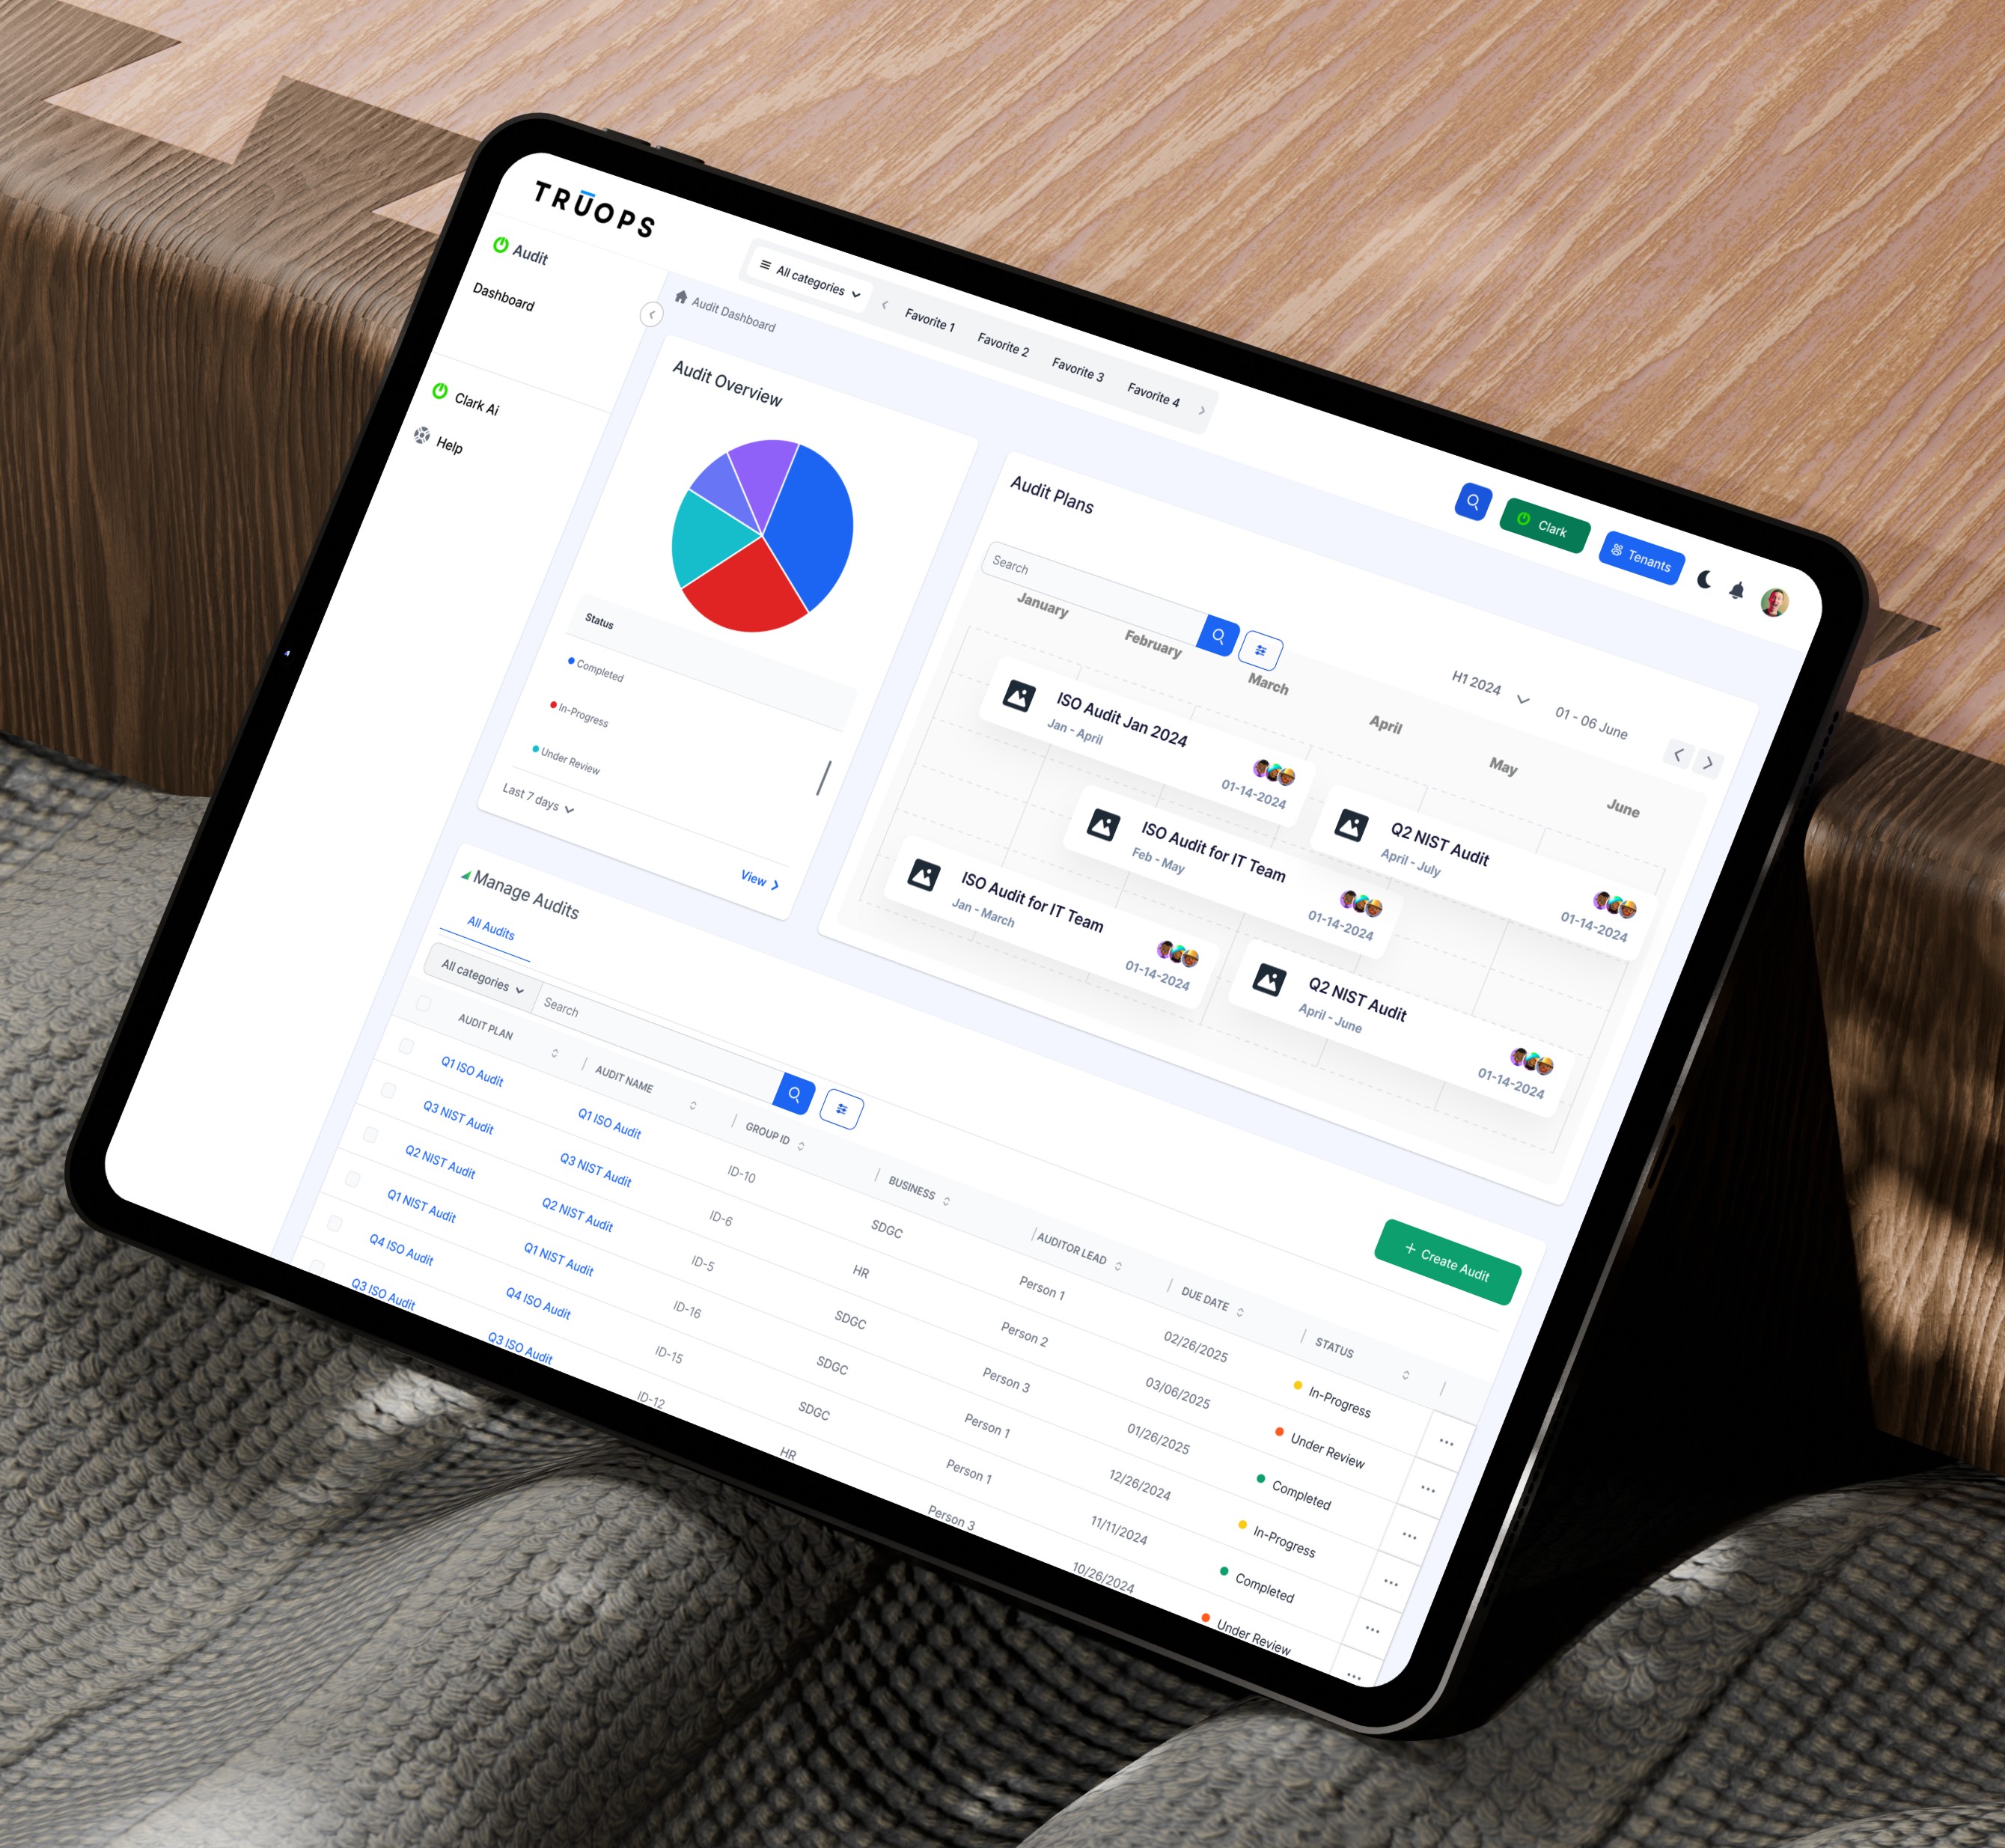
Real-Time Global Risk Map: Designed a dynamic, color-coded map that visualizes vendor locations worldwide, highlighting risk tiers and live disruption events—from supply chain shocks to geopolitical unrest and cyber threats—enabling proactive risk management at a glance.
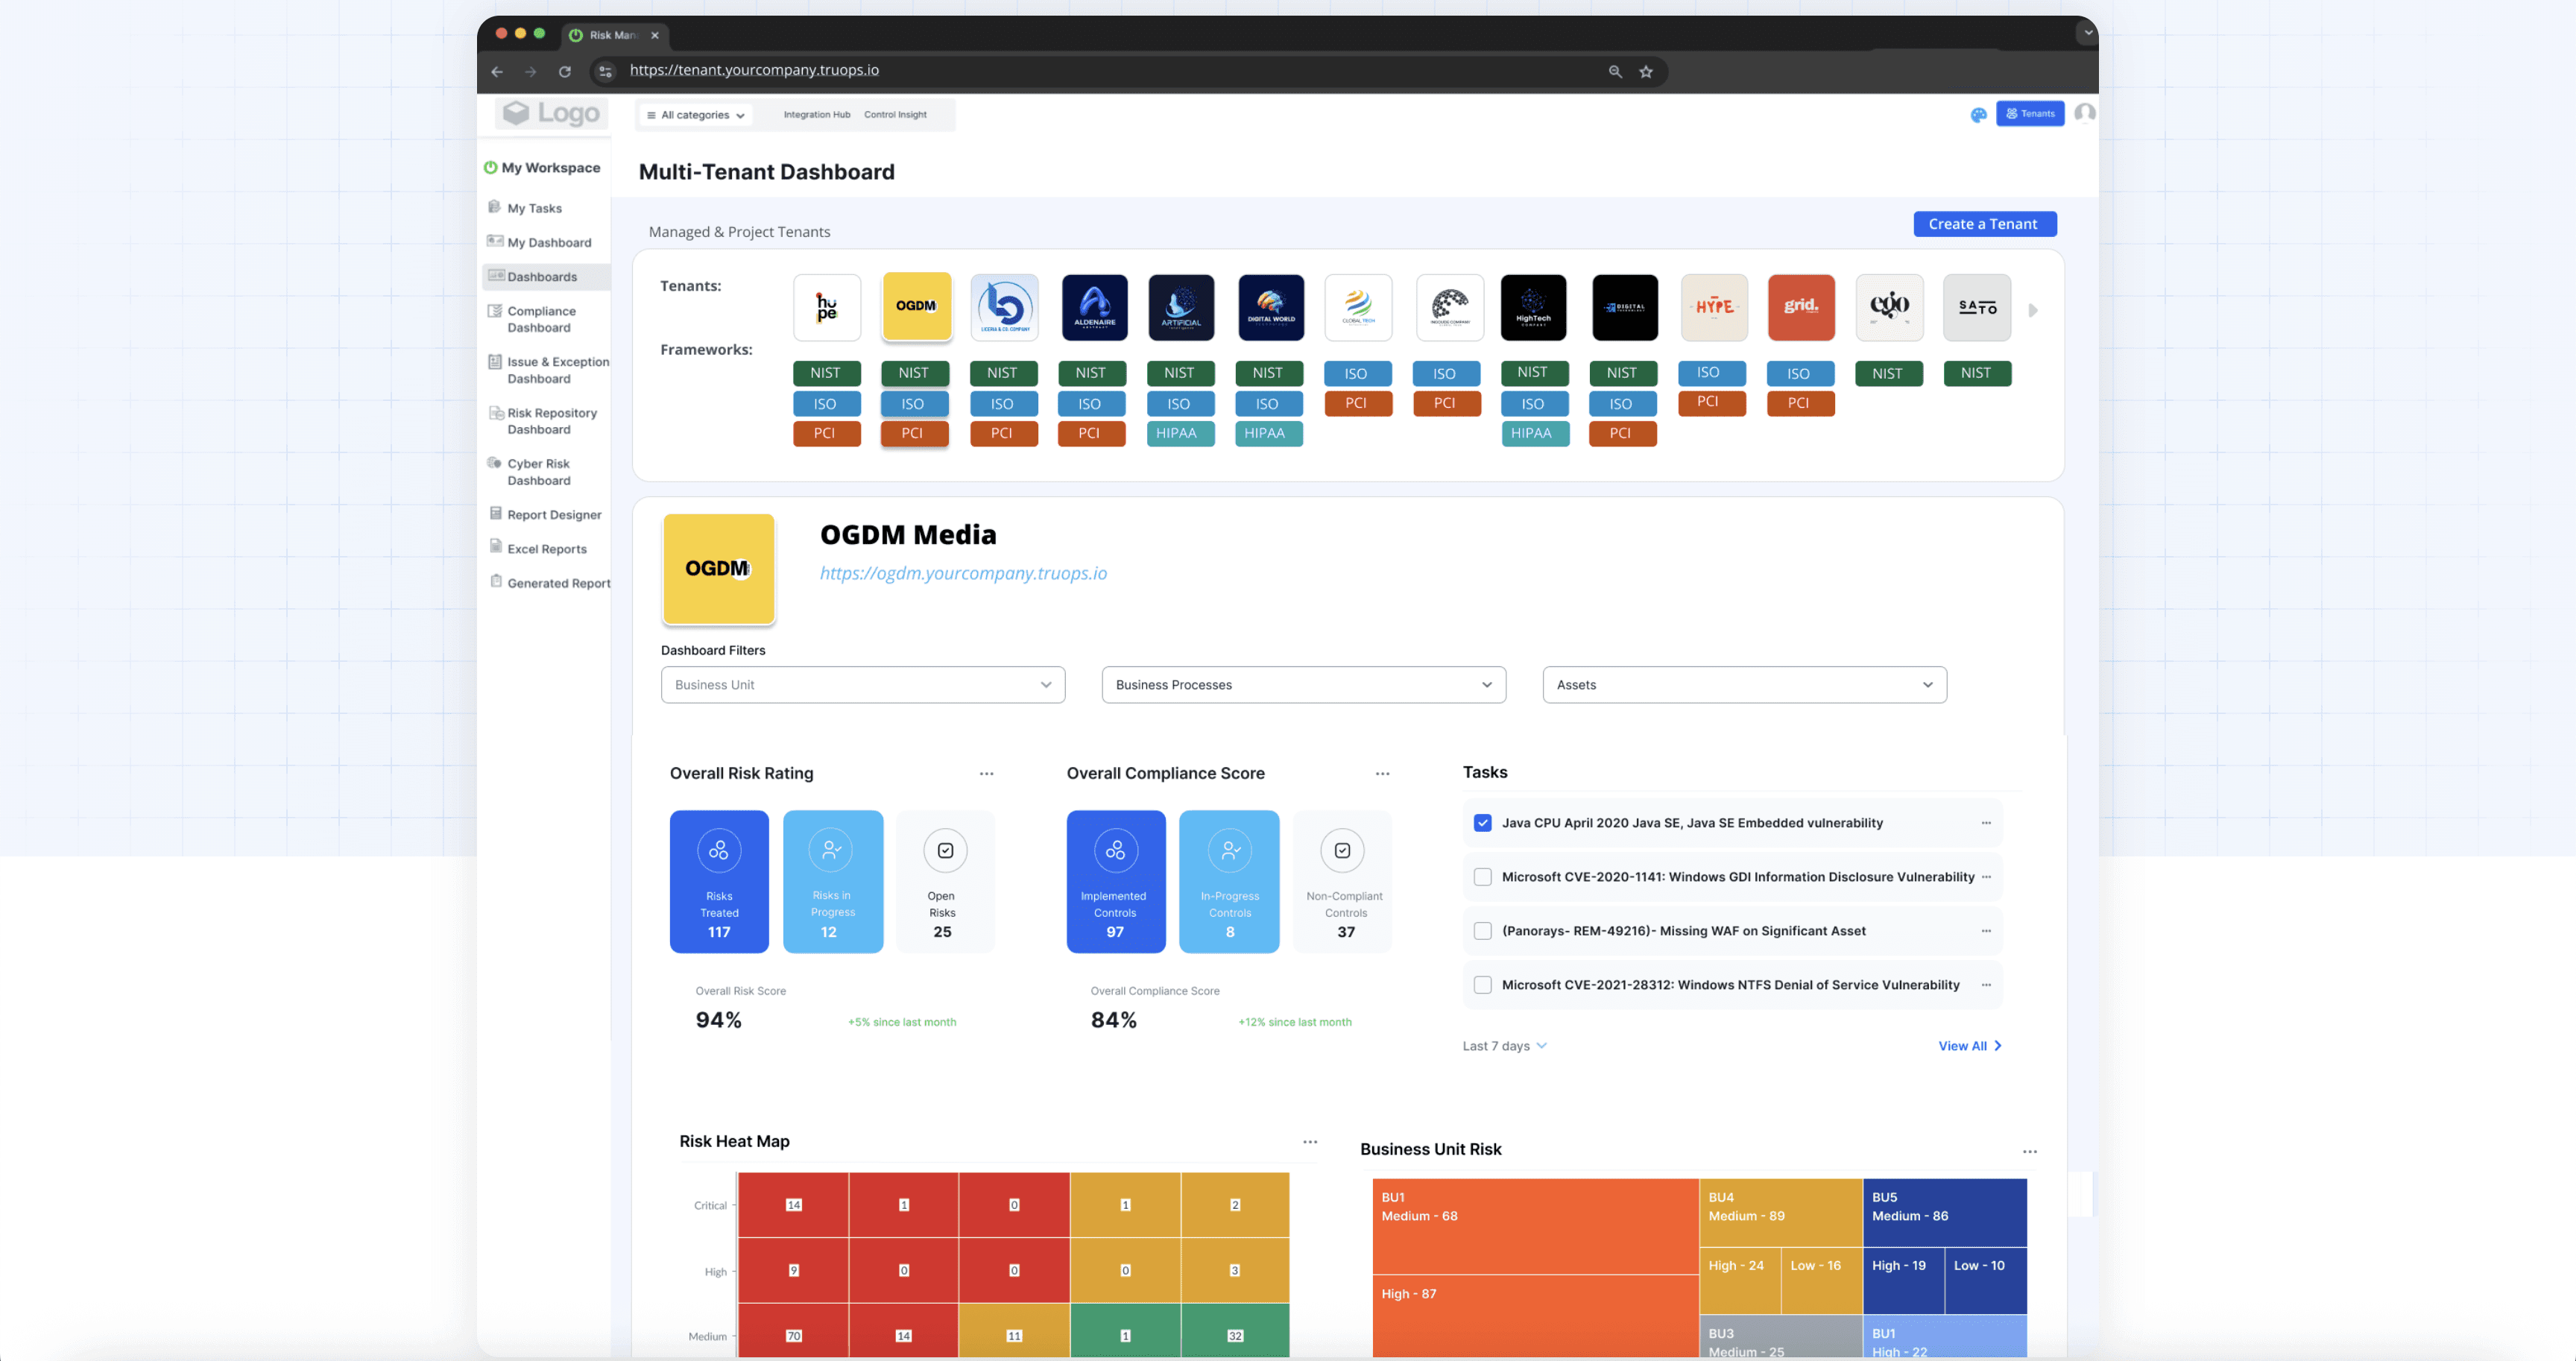
Interactive Risk Dashboard Table: Created a synchronized, detailed table presenting vendor tier, risk scores, location, and active events, bridging spatial insights with structured data for comprehensive analysis.
Advanced Filtering & Drill-Down: Developed robust filtering tools that allow teams to rapidly isolate impacted vendors by location, risk level, event type, or supply chain role—accelerating triage and response workflows.
This solution fundamentally shifted GRC teams and executive leaders from reactive to proactive risk management, reducing response times from days to real time and dramatically improving supply chain resilience.
55%
25%
34%


Process
As Lead Designer, I led the full design process—translating complex cybersecurity data and high-risk use cases into a clear, user-friendly risk visualization feature. From discovery and data modeling to prototyping and design system integration, I ensured every step aligned with both technical requirements and user needs in this complex, fast-paced industry.
Discovery & Concept Validation
Identified the need for visual situational awareness, especially in high-risk verticals like healthcare, finance, and manufacturing
Audited common third-party risk tools to confirm lack of live event mapping in GRC space
Experience Mapping & Data Modeling
Mapped key use cases like “Which of our critical vendors are impacted by a flood in India?” or “How many Tier 1 suppliers are in active shock zones?”
Designed data models to support vendor metadata (risk level, location type, tier) alongside dynamic event data
UI Design & Visualization Strategy
Created a live global map interface with zoomable views, filterable overlays, and interactive vendor/event pins
Built a risk/event table synced with the map to give users both spatial and structured views
Developed visual patterns for “Event Alerts,” vendor clustering, and real-time status indicators
Prototyping & Stakeholder Feedback
Delivered high-fidelity prototypes simulating real-world use cases (e.g., supply disruption in Southeast Asia)
Gathered feedback from internal stakeholders and select enterprise clients on clarity, utility, and UI behavior
Iterated to improve event hover states, map-to-table syncing, and filter logic
Design System Extension
Introduced net-new components like map pins, event tags, filter bars, and vendor risk pills
Ensured accessibility, performance, and alignment with the broader Fortress product design system
Results
The Global Vendor Risk Incident Dashboard was a groundbreaking, first-of-its-kind solution—built from the ground up with no existing blueprint—to transform Fortress’s platform into a dynamic, real-time nerve center for vendor risk management. This complex innovation unlocked unprecedented business and user value by enabling security and procurement teams to visualize and respond to global vendor disruptions instantly, a capability previously unavailable in the market.
Key impacts included:
Real-Time Vendor Visibility: Delivered instant, geo-coded insights into vendor risk exposure and active disruptions, revolutionizing situational awareness.
Accelerated Response Times: Empowered clients to triage and mitigate risks within minutes, significantly boosting operational resilience for critical infrastructure.
Increased Client Engagement: Dramatically improved platform adoption among security and risk teams managing vast, complex vendor networks.
Market Differentiation: Established Fortress as the clear leader in real-time vendor risk visualization, driving new customer acquisition and retention.
Scalable Innovation Foundation: Created a robust platform for future capabilities like AI-driven impact alerts and predictive risk scoring.
By replacing static, delayed risk reports with live, actionable insights, this dashboard redefined vendor risk management—enabling faster, smarter decision-making that safeguards critical infrastructure in an increasingly volatile world.